Practice
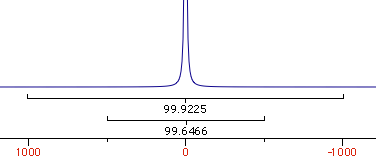
Why integral values can never be accurate? I have prepared a set of 2 examples. One contains a single peak in time domain, the other contains a single lorentzian shape. In each case it's possible to alter the linewidth or even to change the shape to gaussian. As usually the required reader is iNMR, which in turn requires Mac OS X. In the time domain example all points are equal to 1. The shape is given exclusively by the weighting function. I have set it to an exponential equivalent to a 10 Hz broadening. After FT the signal is as large as the spectrum, in other words it never reaches zero. There is a significant baseline offset, which actually also contains to the tails of the lorentzian. In the figure below I have already subtracted this offset (the equivalent of multiplying the first point of the FID by 0.5).

When the integrated region is 100 times the linewidth, the area is still significantly far from the 100%. From the other spectrum I have measured slightly different values, because I have arbitrarily set 100 equal not to the total area, but to the area of a region 2500 times larger than the linewidth.
| interval/linewidth | area % |
| 10 | 93.6 |
| 20 | 96.8 |
| 100 | 99.4 |
| 250 | 99.7 |
| 500 | 99.9 |
| 5000 | 100 |
With your experimental spectra is not the case to define wide integration intervals, like those shown above. Everything works fine because linewidths are comparable and the error is almost constant. Expect to measure lower integrals for wider peaks, even when the relaxation delay is very long.

1 Comments:
This comment has been removed by a blog administrator.
Post a Comment
<< Home